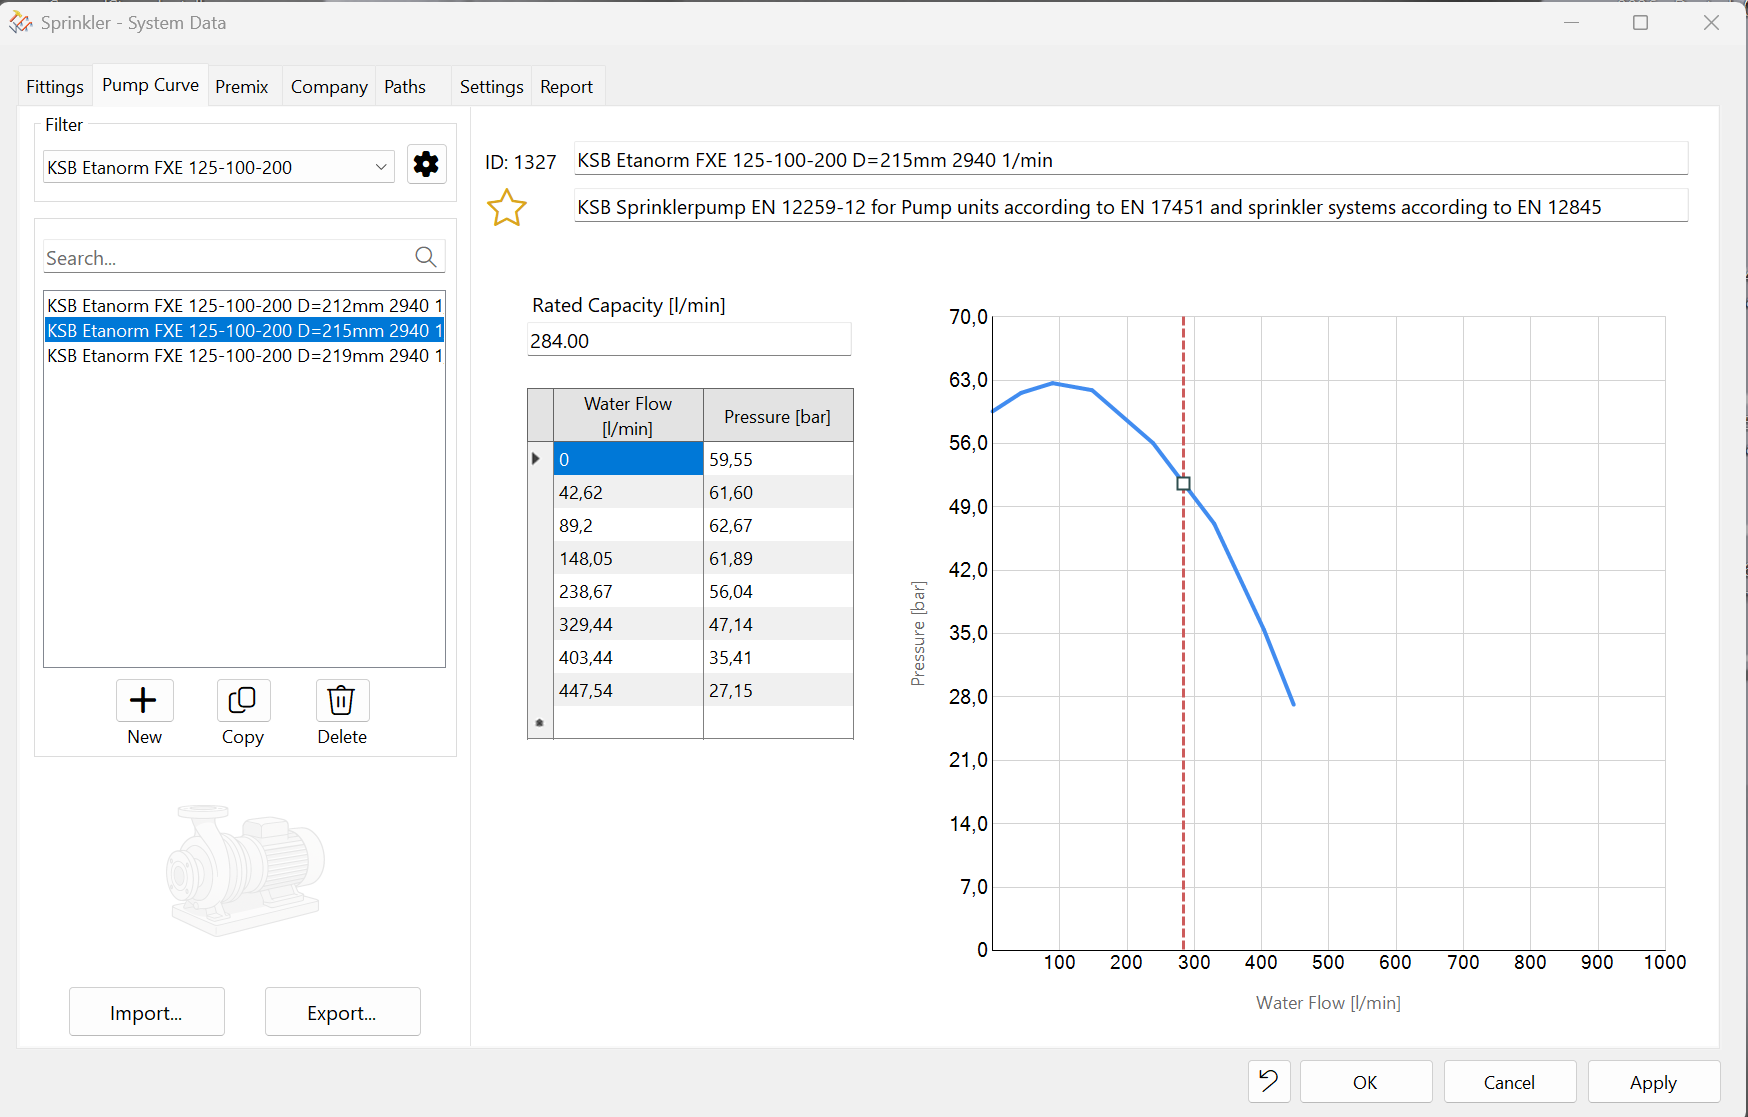
Pump Curve
Function: Edit, delete, and recreate pump performance curves. Preview the pump curve.
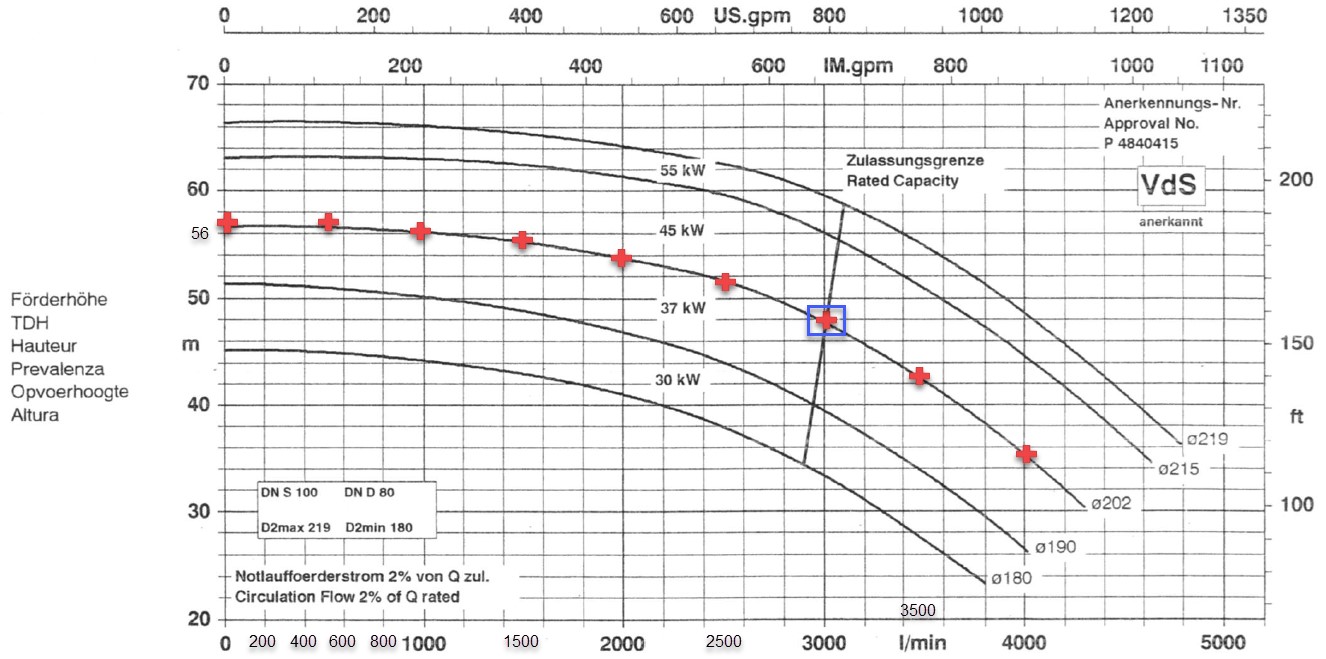
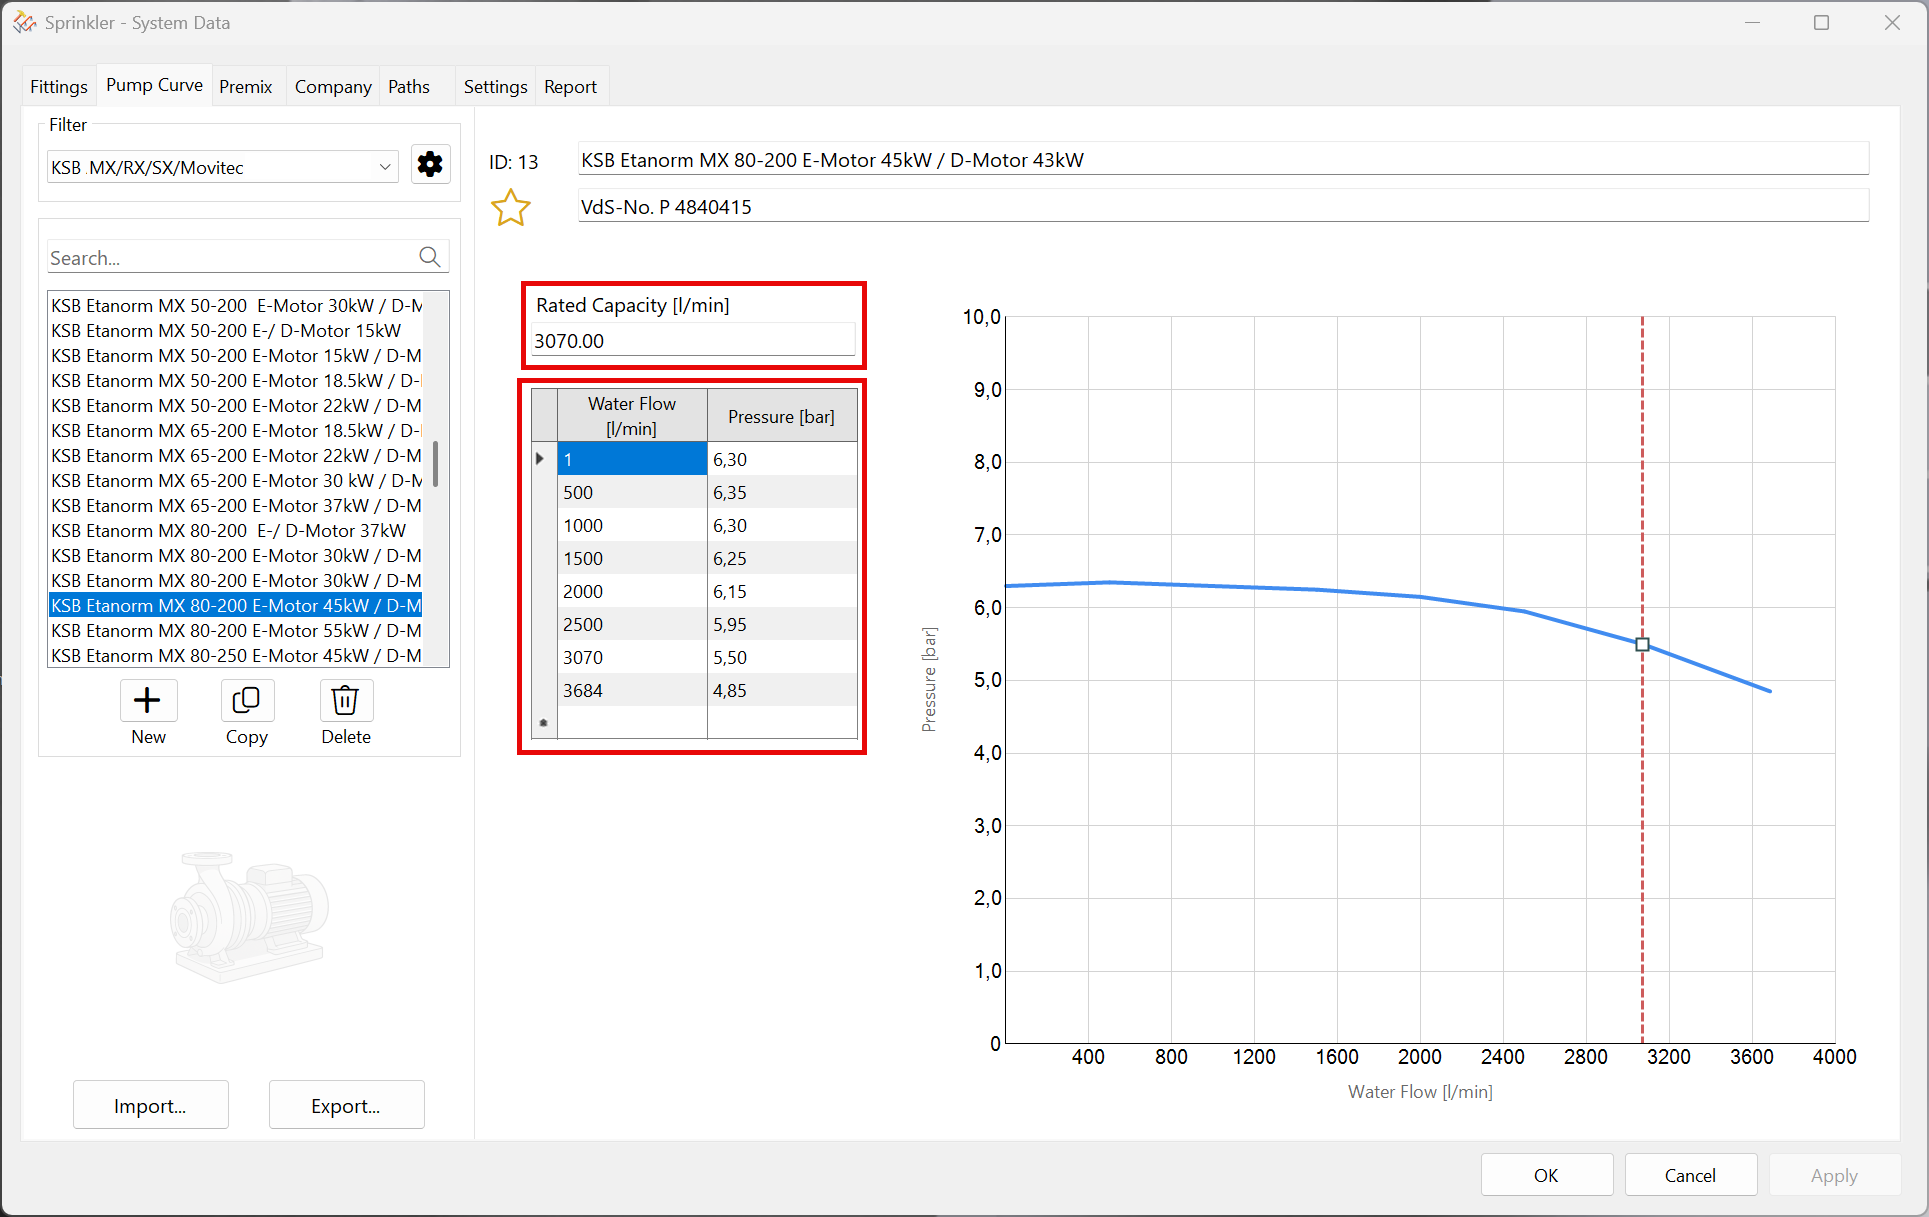
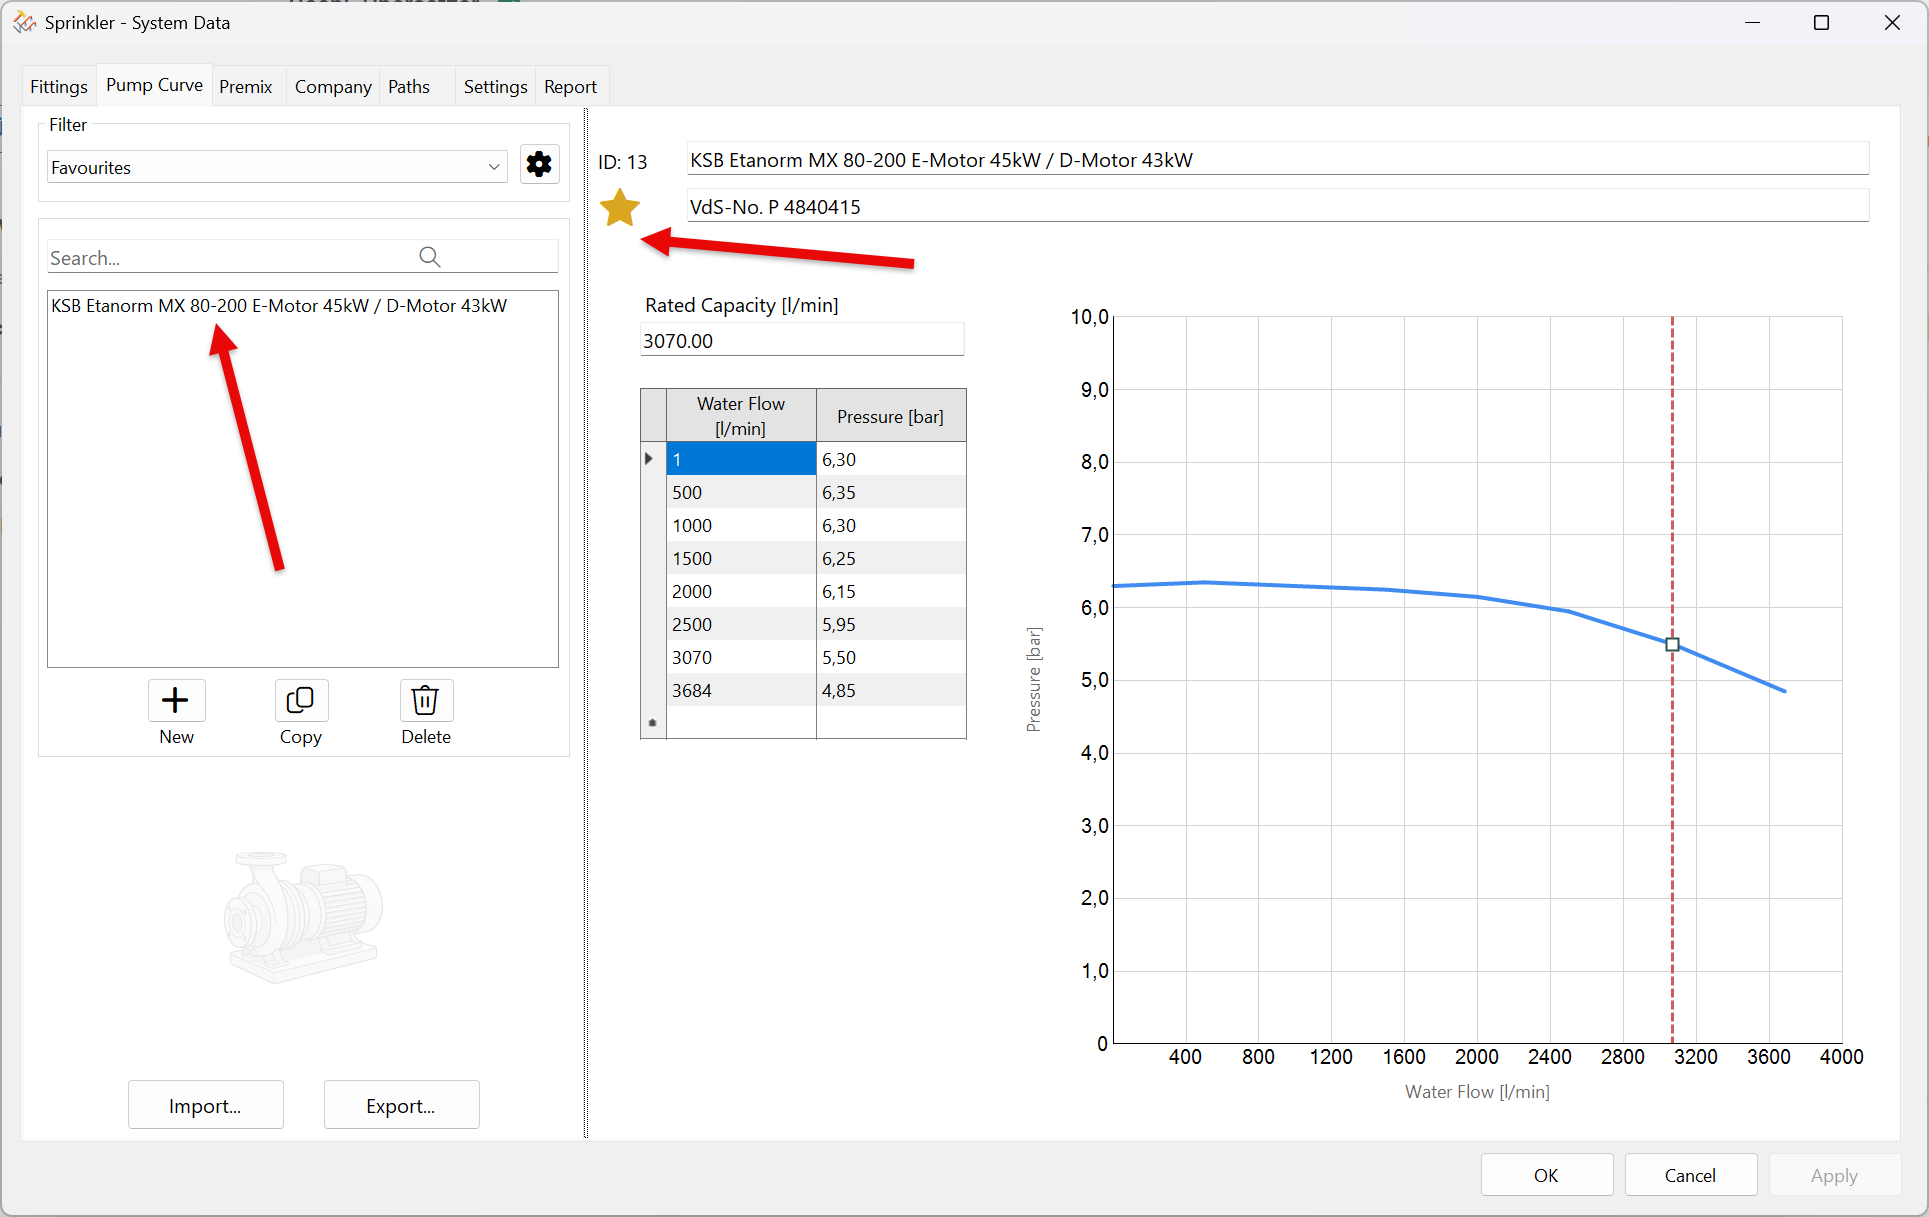
Use the performance curve of the installed pump, which can be obtained from the manufacturer, as a reference. In the example: KSB Etanorm MX 80-200 45 kW, impeller 202.
Identify key points along the pump curve and plot them in the table shown above. Meters of water column must be converted to bar here. It is important to note the pump’s approval limit (marked in blue), which must be included in any case. The maximum achievable l/min are noted separately in the table on the right at the top. It is also possible to request the appropriate data pairs directly from the manufacturer and enter them directly.
This allows you to enter your own pump characteristic curves.
The pairs of numbers and the limit values are then entered here. A corresponding curve is generated in the preview.
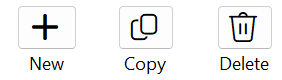
The following functions allow you to add, copy, or delete pump performance curve data.
When creating new pump curves or making changes to existing pump curves, you must always click the “Apply” button before switching to another pump.
Otherwise, a warning message will appear. Values from other pumps can be copied and pasted using Ctrl+C and Ctrl+V, even across rows.
This icon appears while editing at the bottom of the dialog box. Any changes you've made can be undone immediately.
The features for creating filters, managing them, and generating new characteristic curves work exactly as described in detail in the chapter on Fittings.
Another special feature is the ability to add items to your favorites. Select a pump and click the star icon:
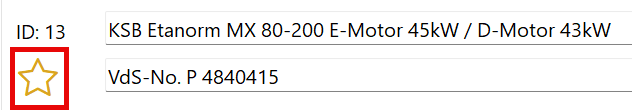
The pump will automatically appear in the favourites filter:
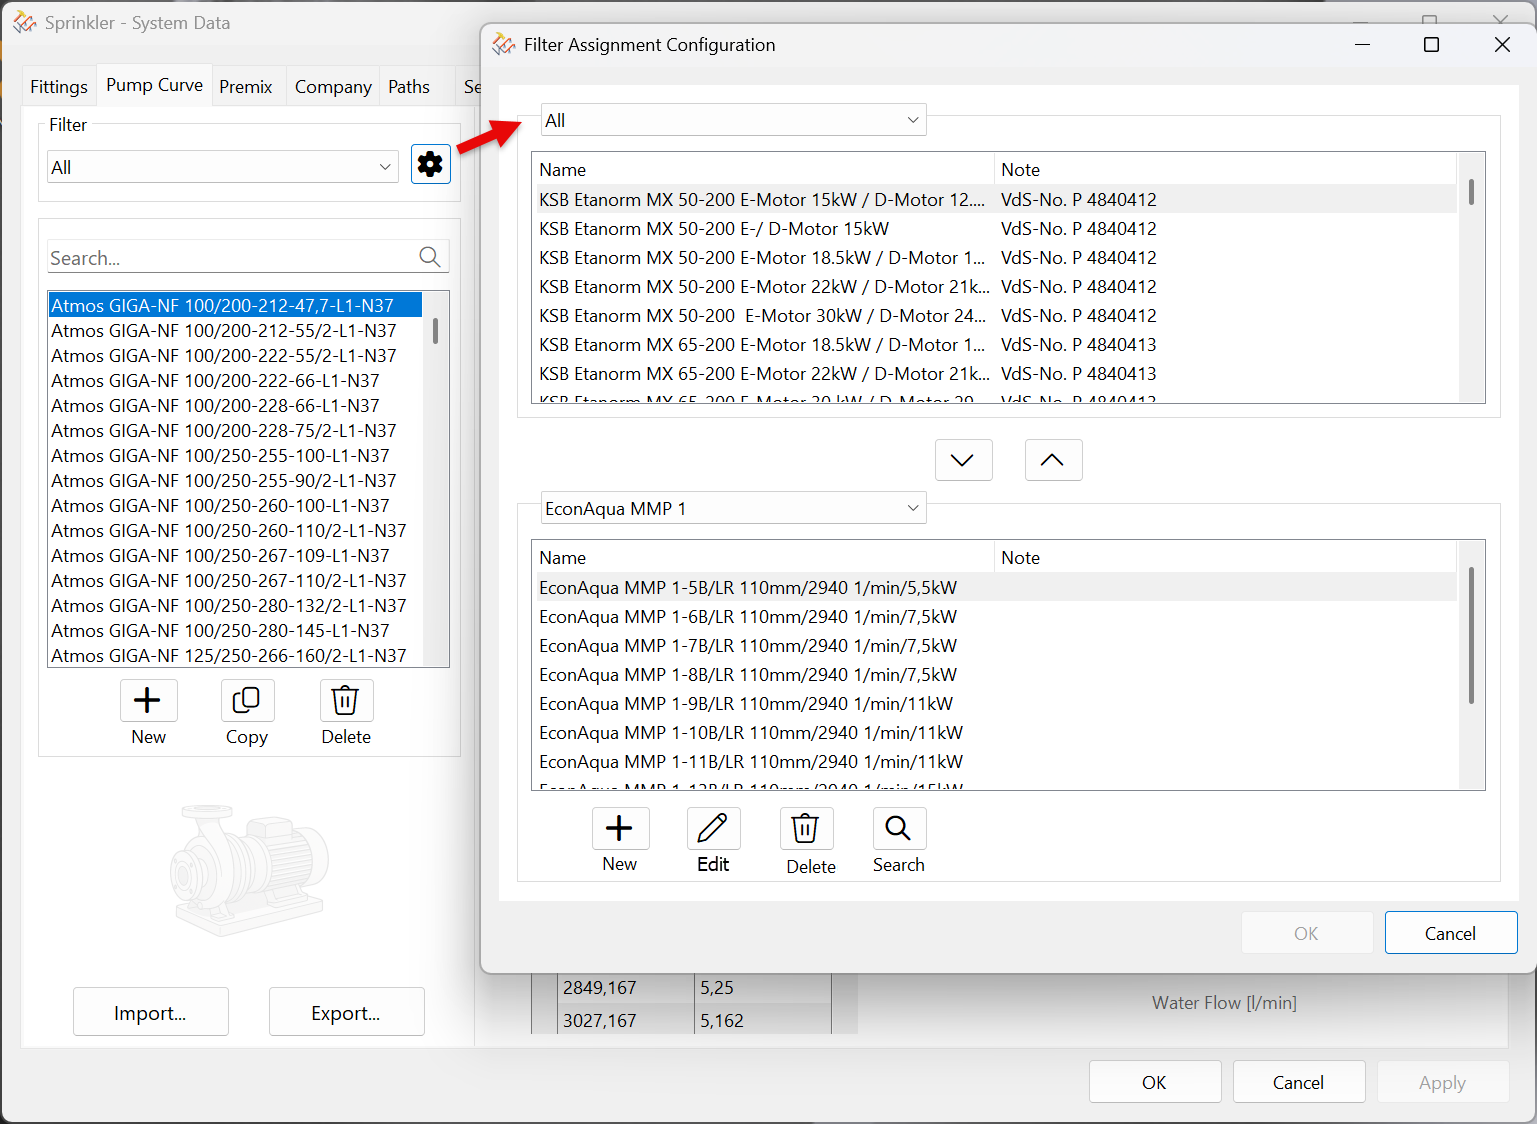
Settings button creates, modifies, and deletes filters. Use the Up and Down arrows to assign pump curves to filters or remove them. The filter can only be deleted once the pump curve has been removed. Only one entry is allowed per group. Use the New, Modify, or Delete buttons to edit or create filters accordingly. The Modify button only changes the filter name.
Note: The newly created filter must first be confirmed with OK. Then the appropriate pump curves can be assigned to the group.
The Export function generates a DOS file that can be imported into another pump characteristic curve file. Conversely, a DOS file can also be imported using the Import function.
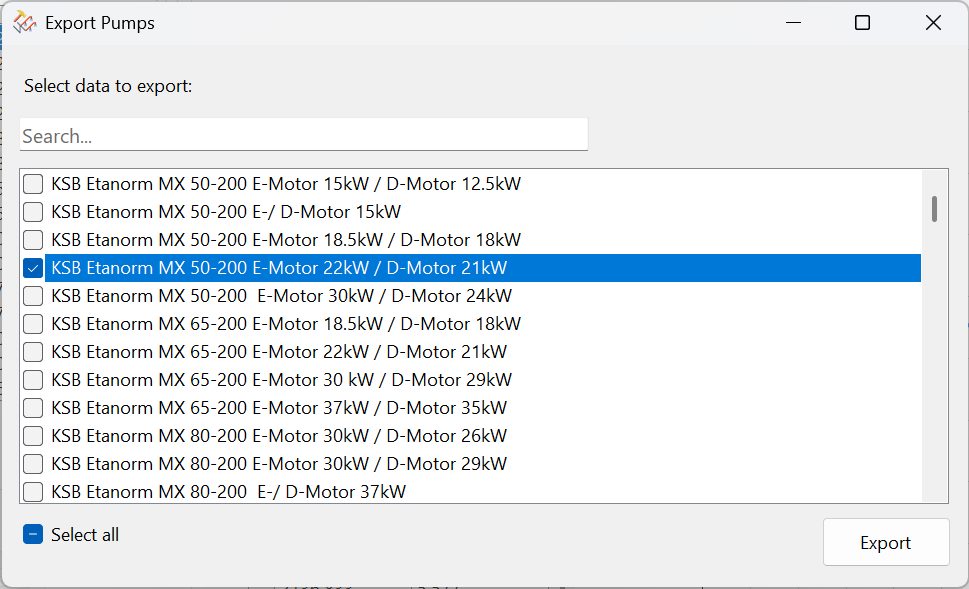
File name : Name of Pump_Date.DAT
A file can be selected for import in a standard WINDOWS dialog box.