Display pressure loss
Icon:

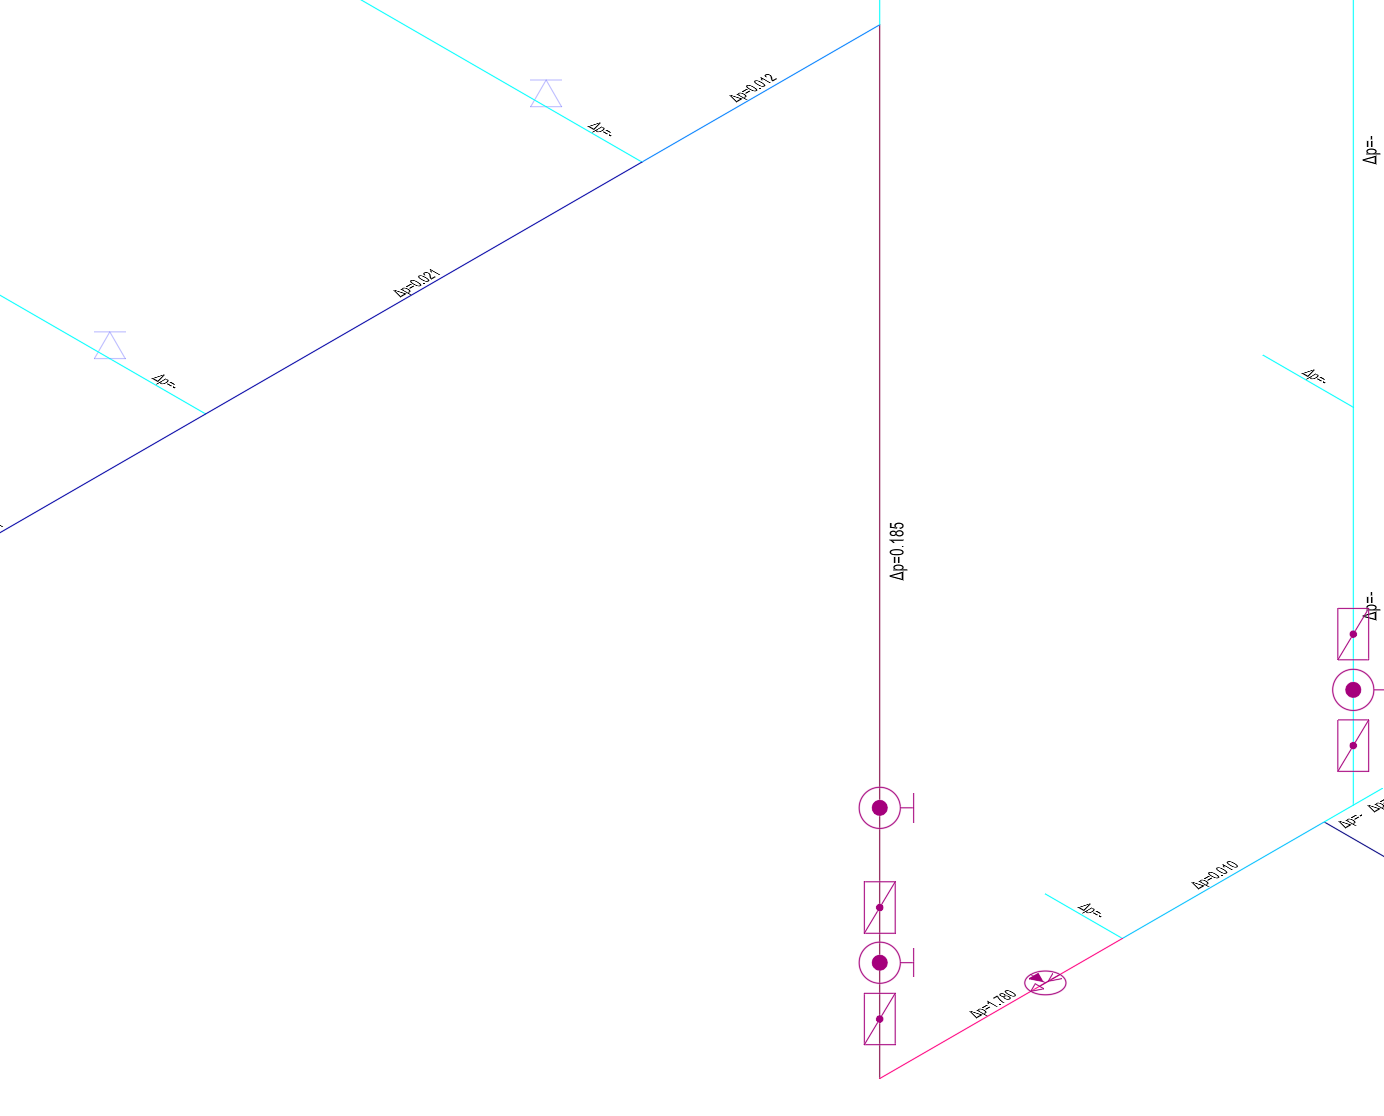
Function: Generate a graphical representation of pressure losses (bar), including the calculated values displayed as text on the pipes.
All pipes, branch pipes, and sprinkler supply pipes are colored in different shades according to their pressure losses, based on a color scale. This scale is the same for all filters.
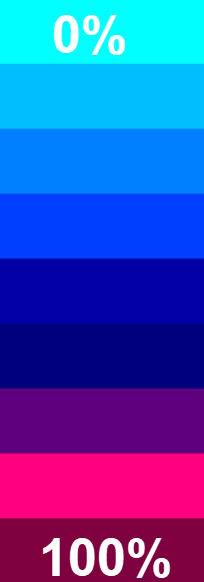
The colors used for this can be set in the Parameter file/Darst. For all filters, the range is from the lowest calculated value of 0% to the highest value of 100%. Light blue represents the lowest value, and dark red represents the highest value.
Labels for isometric views after selecting a filter can be controlled via Project Management/Labeling.
Overview: