Characteristic pump curves
With this program point it is possible to edit pump curves for your project.
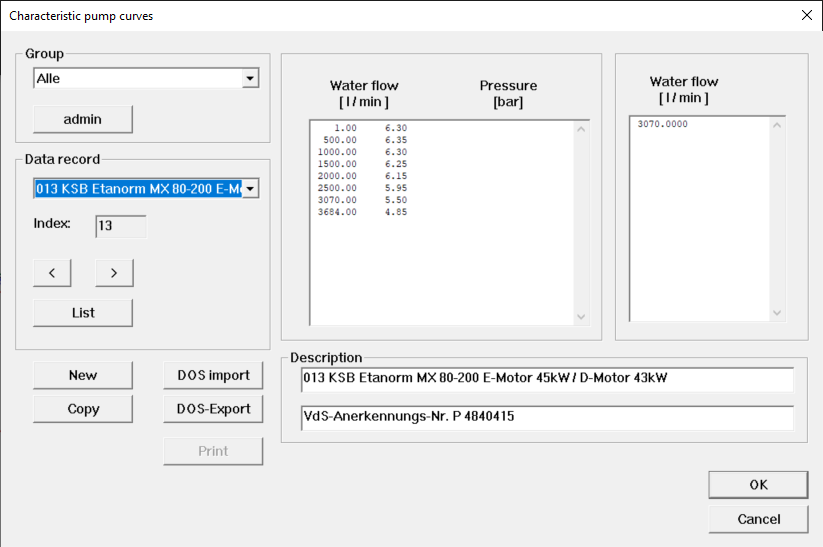
As template you choose the pump characteristic curve of the installed pump.Data you get from the manufacturer.
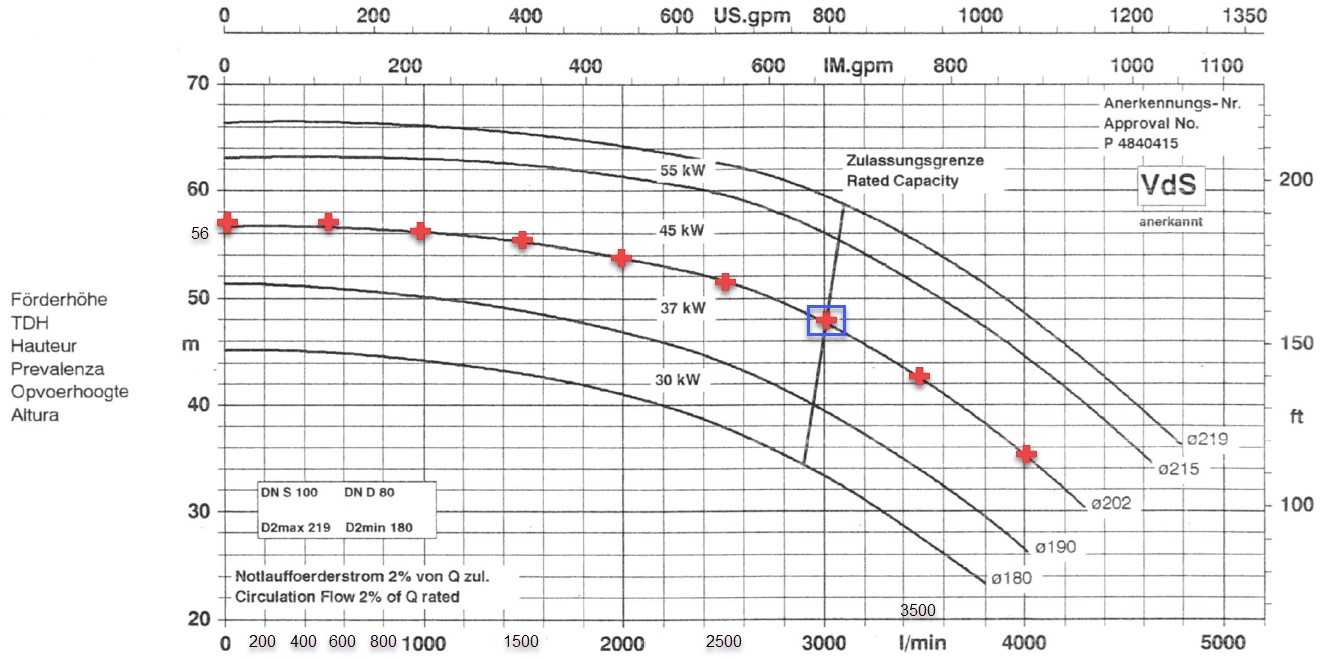
F. ex. KSB Etanorm MX 80-200 45kW impeller 202.
Find prominent points along the pump curve and plot them in the table above. mWS must be converted to bar here. Important here is the pump's approval limit (marked in blue), which must be shown in any case.
The max. l/min. to be achieved are specially noted in the table on the right above.
In this way you can enter your own pump characteristics.
The features for forming groups, managing them and creating new curves, work in the same way as described in detail in the chapter Equivalent Length Table.
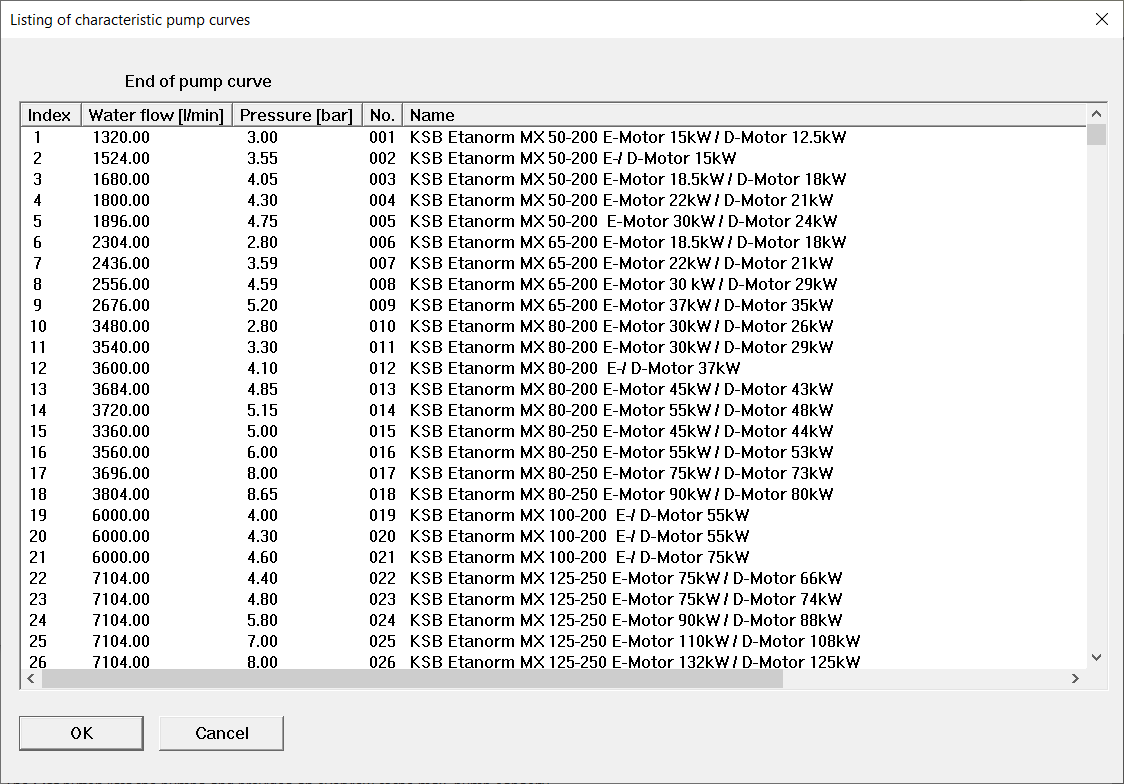
The List button lists the pumps and provides an overview of the max. pump capacity.